
Office utilisation – how your space is actually used
Booking systems show what was booked, not whether anyone showed up.
The second-largest cost, and the least measured
Space is usually the second-largest fixed cost after people, and most decisions about it rest on booking data, walk-arounds and opinion. Ventilation, heating and lighting often run on a timetable rather than on whether anyone is there.
The same questions keep coming back. How many of our desks are genuinely in use on an average Tuesday? Which meeting rooms are booked and then never occupied? Do we need to build, rent, sublet, or simply re-plan?
They usually go unanswered for practical reasons. Manual counting is expensive and out of date the day it ends. Cameras and Wi-Fi tracking raise privacy objections that stall projects. Wired sensors mean cabling, permits and disruption.
Every method trades accuracy against privacy
Occupancy data is only useful if it is continuous, trusted and uncontroversial. That rules out more methods than you would expect.
- Badge data records who entered the building. It is personal data, and it says nothing about which room.
- Wi-Fi and Bluetooth analytics count devices rather than people, and miss anyone not carrying one.
- Cameras count people well, but they use images of people, which brings consultation and objections.
- A booking system alone is blind to no-shows and to unbooked use.
- Passive infrared sees movement, not presence, so it loses a person sitting still.
- Our choice: active infrared for seats and desks; thermopile infrared with both presence and motion data, and algorithms that give 98 % accuracy on presence in rooms; image sensors with embedded AI for counting people in larger rooms; and people counters at entrances. Nothing identifying is ever captured.
The space decides the sensor
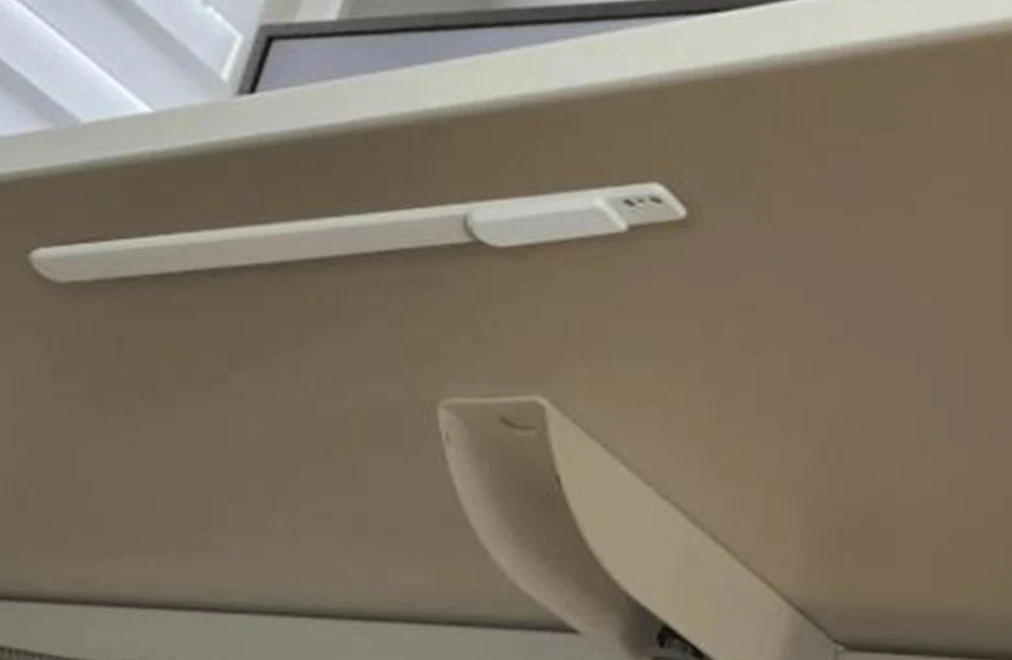
An individual desk asks whether this seat is occupied right now, and gets Strips Presence under the desktop: active infrared. A cell office, a phone booth or a meeting room asks whether anyone is in the room, and gets Square Presence: thermopile infrared with both presence and motion data, and algorithms that give 98 % accuracy on presence. A zone that needs density gets Square CO2 or Square Air. Comfort level in meeting and conference rooms is measured by Square Sound, Square Air and Square CO2 together: sound level, air quality, CO₂, temperature and humidity. For larger rooms we complement our own sensors with best-of-breed third-party image sensors with embedded AI for counting people, and for entrances and passages with people counters. They connect through Yggio like everything else.
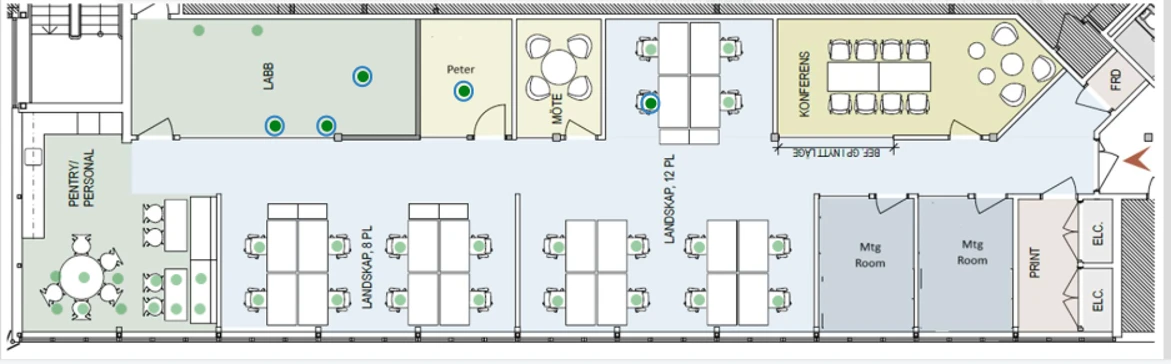
Mixing them costs nothing in complexity, because the data model is the same either way. The plan below is our own office at Mobilvägen 10 in Lund, where we run exactly this: a sensor on every desk and in every room, all on one LoRaWAN network, and every marker live in Yggio’s floor-plan widget.
What each one measures
- Strips Presence: 3 mm ultra-thin desk and seat occupancy, active infrared up to 50 cm, 10+ years battery life.
- Square Presence: room presence up to 4 m, thermopile infrared with presence and motion data, 98 % accuracy on presence: reacts the moment someone enters, keeps reporting occupied while they sit still. Plus temperature, humidity and light. More than 10 years battery life.
- Square CO2: measured CO₂, ±(100 ppm + 10 %), plus temperature, humidity and light: zone density and comfort level. More than 10 years battery life.
- Square Air: indoor air quality index, VOCs and CO₂ equivalent from a gas sensor, plus temperature, humidity, pressure and light: comfort level. About 12 years battery life when it measures in office hours.
- Square Sound: sound pressure level 45–91.5 dB with alarms, plus temperature and humidity: comfort level in meeting rooms and open-plan areas. 10 years battery life.
- Third-party AI image sensors and people counters: best of breed sensors for counting people in larger rooms, classrooms, and at entrances; the AI runs in the device and only counts leave it.
What they have in common
- Wireless over LoRaWAN, with no network or power outlet needed at the sensor
- Anonymous readings only: occupied or vacant, counts, ppm
- Small, discreet and silent, with no LEDs blinking in the room
- One data model in Yggio: building → floor → zone → room → desk
- Add another sensor type later without touching the dashboards
- Adhesive mounting; movable and reusable

Privacy by design, not privacy by policy
There is nothing to anonymise, because nothing identifying is ever captured. The sensors send occupancy status, counts and parts per million. They do not capture images, sound, device identifiers or anything that can be traced to a person.
That distinction is usually the point at which a measurement project either gets approval or does not, so it is worth taking the objections early and in the open, and reporting at whatever level of aggregation your own policy allows.
Data is encrypted from the sensor to the platform. Yggio runs as a service, on your own servers or at the edge, so where the data lives is your decision, and the platform is independently penetration-tested.
Booked vs. actually used
The booking system knows the intention. The sensors know the outcome. Joining them is where the money is: booked-but-empty rooms are identified automatically, so the no-show list writes itself; unused bookings can be released back to the pool; and ventilation and lighting run on booking plus measured presence rather than on a timetable.
The integration runs over Yggio’s open API, pulling bookings in and pushing real occupancy back. It needs a mapping of rooms, resources and bookings, not development of core functionality. Power BI, Grafana, Node-RED and building management systems connect the same way.
Sensor data alone tells you a room was empty. Sensor data plus bookings tells you who to talk to.
Occupancy data earns its keep on the first of the month
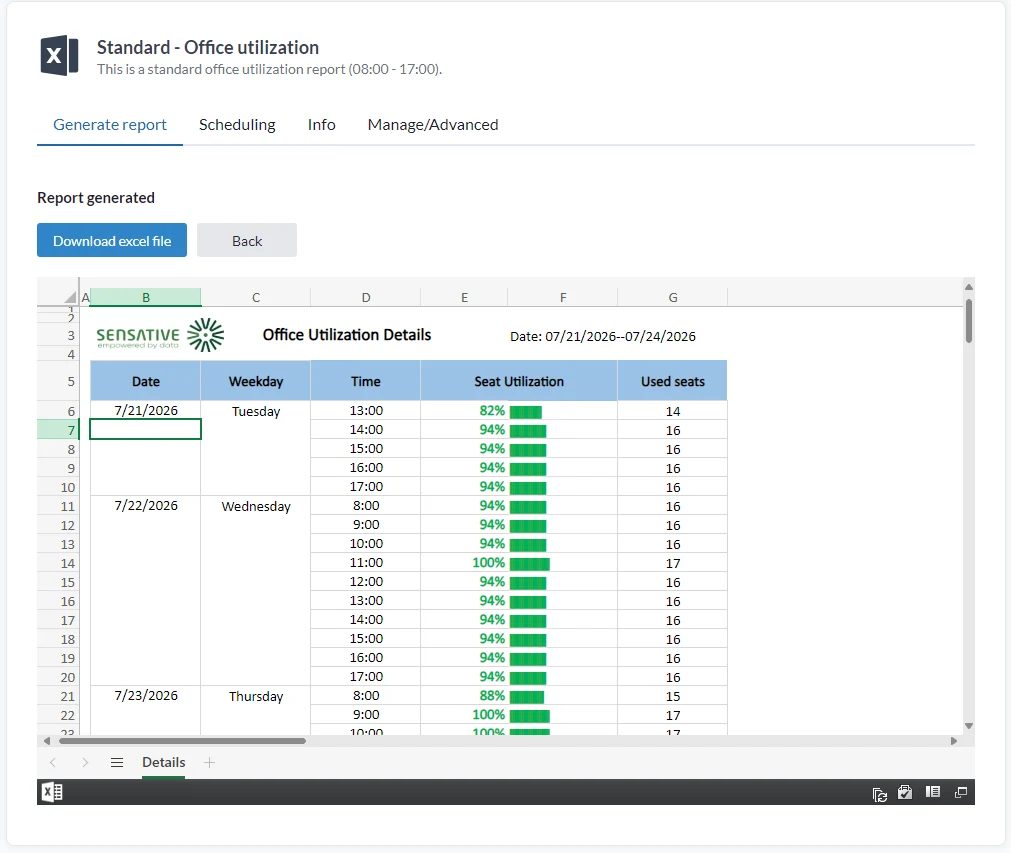
Yggio ships a standard office utilisation report: seat utilisation and used seats per hour and per weekday, generated on demand or on a schedule and delivered as an Excel file. For anything else, upload your own template and generate against it, or pull the time series through the API.
The reports people actually ask for are the same everywhere: utilisation by room type and by floor, the peak-hour profile per week, desks below a utilisation threshold for a quarter, and the no-show list for meeting rooms.
Where the answers become operations
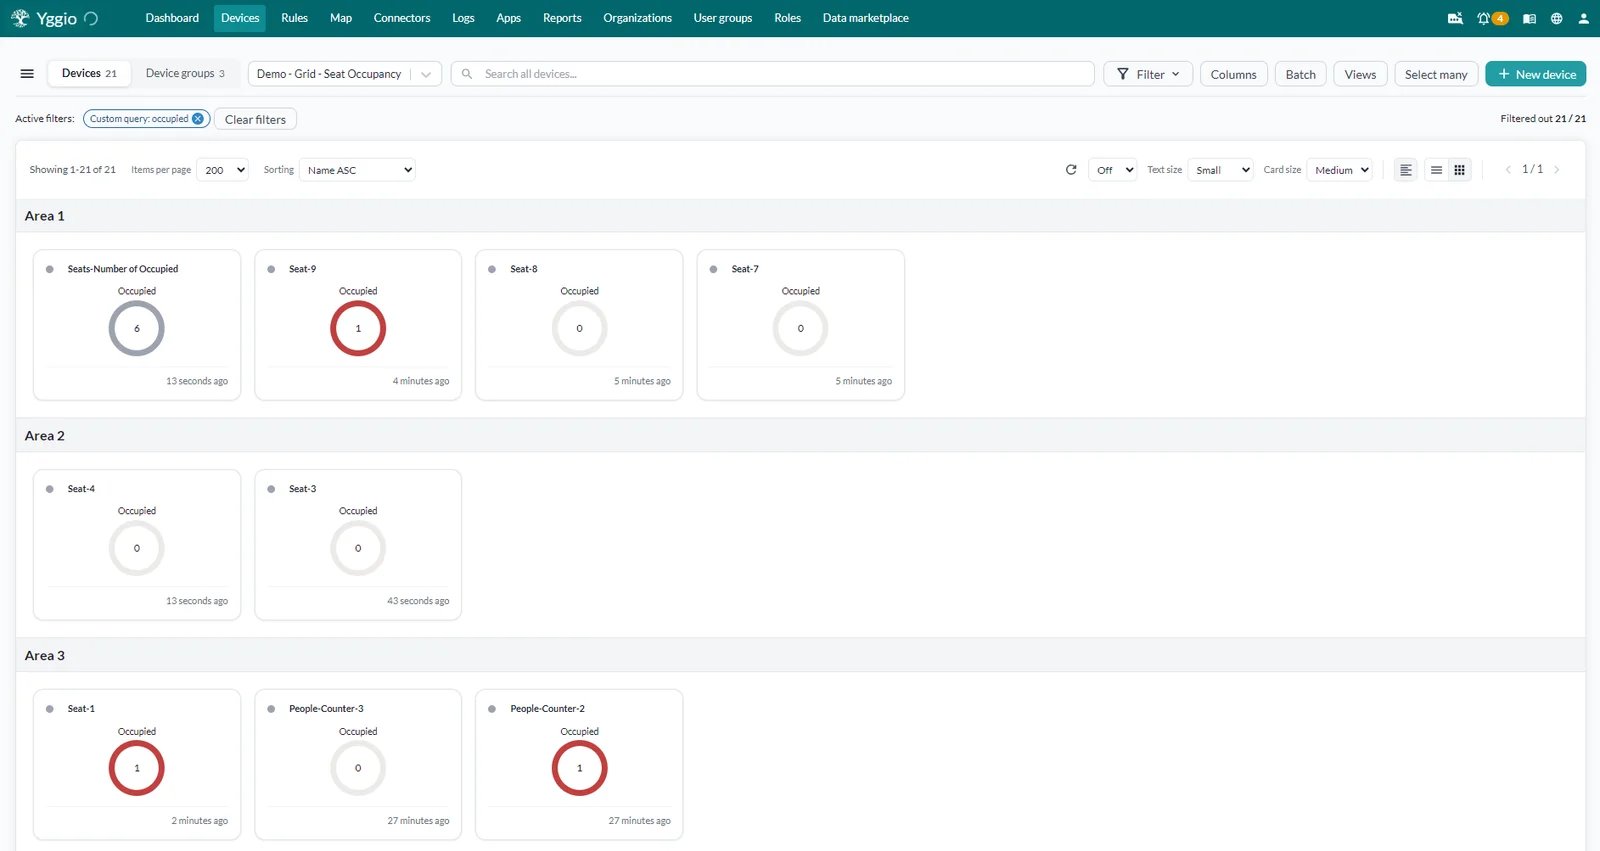
The sensors answer questions; Yggio is where the answers change what the building does. Translators map every vendor’s payload into the same model, so a floor with our sensors and third-party counters still produces one consistent picture: every seat occupied or vacant, grouped by area, with a count per zone.
What your team sees is configured per role and runs in the browser: floor plans with live room and desk status, dashboards per site, and an overview across the portfolio. From there the data drives more than reports: ventilation and lighting that follow occupancy, cleaning dispatched to the rooms that were actually used, and a defensible basis for deciding whether to build, rent, sublet or re-plan.
From pilot to portfolio
Four milestones, each one something you can inspect. First the design: site survey, gateway and sensor placement, and a naming and metadata convention agreed. Then the network: gateways installed and Yggio configured for your hierarchy and roles, with data communication validated. Then the sensors: they arrive pre-configured and are mounted by your own staff after hands-on training, named, tagged and function-tested. Finally commissioning: functional tests run together with you, documentation delivered, acceptance signed.
The impact on the premises is close to nothing. The sensors are battery-powered: no power outlet, no network outlet, no cabling. Battery status for every sensor and the quality of the radio network are tracked continuously in Yggio, so a sensor that will need attention shows up long before it goes quiet.